CORE | B3

    Collateral margin is defined by the risk for the closeout of a portfolio faced by the clearinghouse.

    • Risk Measure

      In order to calculate the risk for the closeout of a portfolio consisting of positions and collateral from several markets and asset classes, B3 developed an innovative risk measure: Close-Out Risk Evaluation (CORE).

      Key CORE benefits:

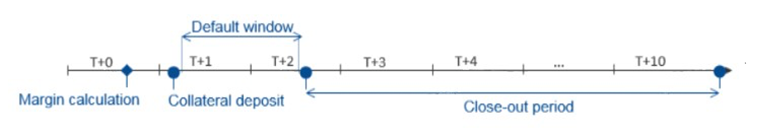
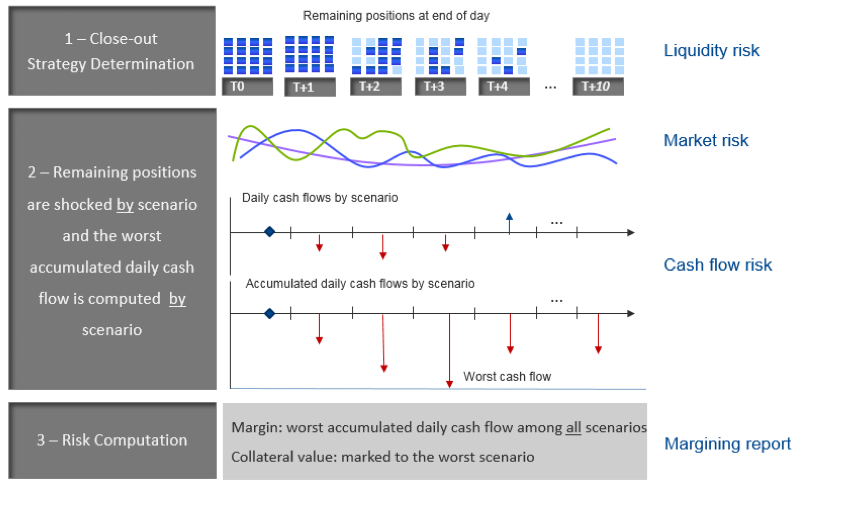
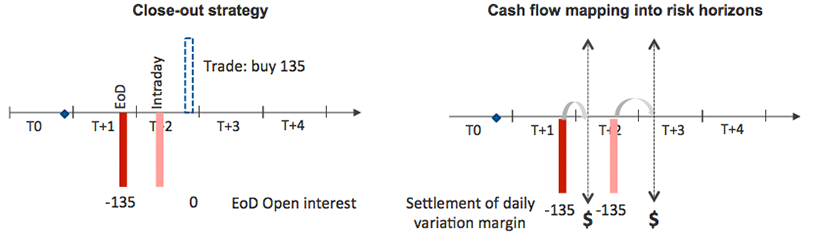
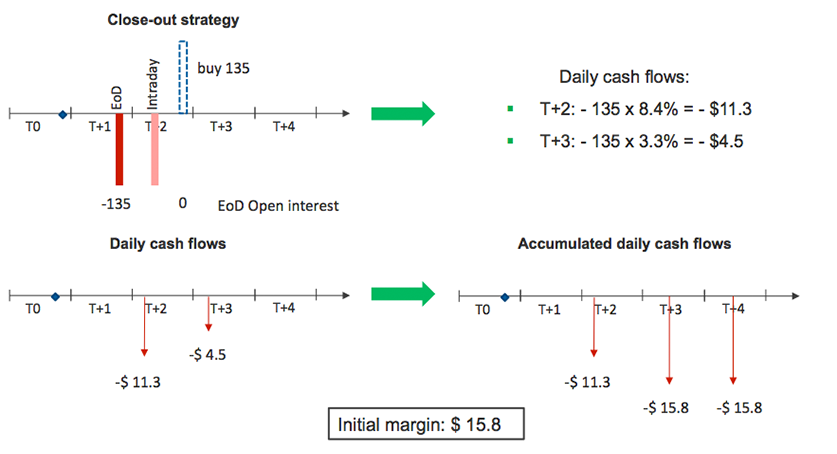
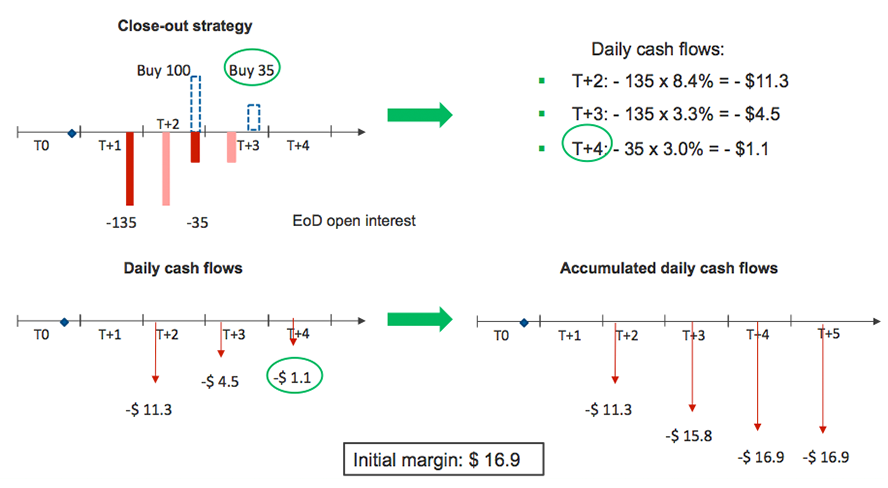
      • It calculates the worst accumulated cash flow during the portfolio closeout process
      • It calculates the joint risk for positions and collateral
      • It models three types of risk: market, liquidity for positions and collateral, and cash flow
      • Accurate closeout strategy: position closeout transactions and collateral execution
      • Severe loss (stress test): confidence level of 99.96% or 10Y crisis
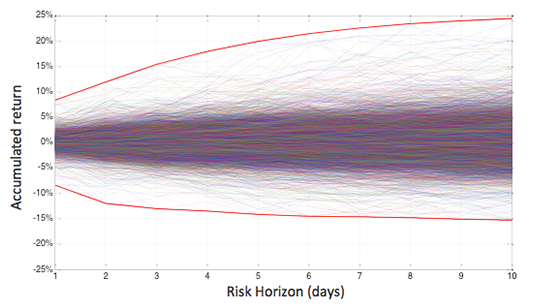
      • It considers 10,000 scenarios: historical (since 2002), quantitative and prospective
      • Multi-horizon: daily closeout operations (1 to 10 days)
      • It apllies full valuation
    • Risk Faced by the Clearinghouse

      Originally, the risk faced by the clearinghouse is the credit risk of its participants.
      After a default, the CCP has to close-out the defaulting customer’s portfolio.
      During the closeout processes, the clearinghouse faces a risk of severe losses generated by:

      • Market risk (price fluctuation of positions and collaterals)
      • Liquidity risk (price fluctuation caused by the liquidation of the position against the normal trading flow)
      • Cash flow risk (non-availability of liquid funds to meet financial obligations)
    • Margining Cycle

      Cycle consists of four moments:

      1. Collateral balance calculation;
      2. Collateral posting;
      3. Default window: period in wich the default may occur;
      4. Closeout period

      ciclo-colaterizacao-EN.png

      • To model closeout is necessary assume that margin calculation and collateral posting were performed
      • Daily cycle: default occurs after collateral posting on T+1 and until settlement window on T+2
      • Closeout strategy: set of operations to closeout positions and execute collateral
      • Closeout period: from the last moment of the default window until the end on T+10
    • CORE Components
      1. Liquidity risk:
        • Close-out operations depend on the liquidity of positions and collateral
        • Individual daily liquidity parameters guarantee orderly liquidation processes
        • Liquidity parameters: estimated on market microstructure data (order-book)
      2. Mapping cash flows into close-out risk horizons:
        • All cash flows generated during the close-out period are mapped in time
        • These cash flows depend on the features of positions and collateral:
          - Trading model: listed vs. OTC
          - Settlement cycle: T+0, T+1, T+2, T+3, … , T+N
      3. Market risk:
        • A scenario for a certain risk factor: 10 simulated shocks (1, 2, … 10 days)
        • A scenario for n risk factors: a matrix with n lines and 10 columns
        • The scenario generation process will be explained in a moment

      CORE is a risk measure calculated through three steps

      componentes-core-EN.png

    • Example 1

      Toy Problems

      Base Case:

      • Position: short on 135 contracts on a hypothetical future
      • Future contract cash flow: daily variation margin settlement in the next morning
      • Collateral: cash
      • Liquidity risk parameter: up 200 / day for an orderly liquidation process
      • Market risk: suppose mapping into only one risk factor; 10,000 scenarios

      Close-out strategy (trades start on T+2):

      • Worst case: Buy 135 contracts at the end of T+2

      exemplos1-EN.png

      Calculation of the worst accumulated cash flow by each one of the 10.000 scenarios
      1 scenario, 1 line, 1 10-day price path: accumulated shock in each 10 risk horizons

      horizonte-de-risco-EN.png

      • Worst case for a short position on one risk factor: extreme positive shocks
      Risk horizon (days) 1 2 3 4 5 6 7 8 9 10
      Accumulated shock 8,4% 12,0% 15,4% 18,0% 20,0% 21,5% 22,6% 23,4% 24,0% 24,5%
      Daily shock 8,4% 3,3% 3,0% 2,3% 1,7% 1,3% 0,9% 0,7% 0,5% 0,4%

      estrategia-de-encerramento-EN.png

    • Example 2

      Case 1 - liquidity risk parameter changes from 200/day to 100/day

      Longer and riskier close-out, higher margin

      exemplos2-1.png